Why?
I’ve been a weather nerd my whole life. I love watching big storms roll in and follow every tropical system that lands in the Gulf of Mexico each year. I’m also a data nerd: Gathering, Analyzing, Storing (i.e. hoarding). I’ve always been interested in having a weather station and after looking at tear downs of consumer grade weather stations I decided I could build something better for way cheaper. I also enjoy building things up to code or specification. I figure if folks at the National Weather Service could build a weather station, so could I. So I decided to follow their guidelines (pdf) as closely as possible. Upon learning these guidelines, I realized it made no sense to try to build the anemometer into the same device as the rain gauge and other sensors, since their requirements are over 25 feet apart in height. So I decided to build the anemometer first and as a separate device.
What?
It sounded pretty easy, just get a wind meter, plug it into an arduino or something, then read the data. That’s exactly what I did, though I figured this documentation would help someone else later.
Key Components
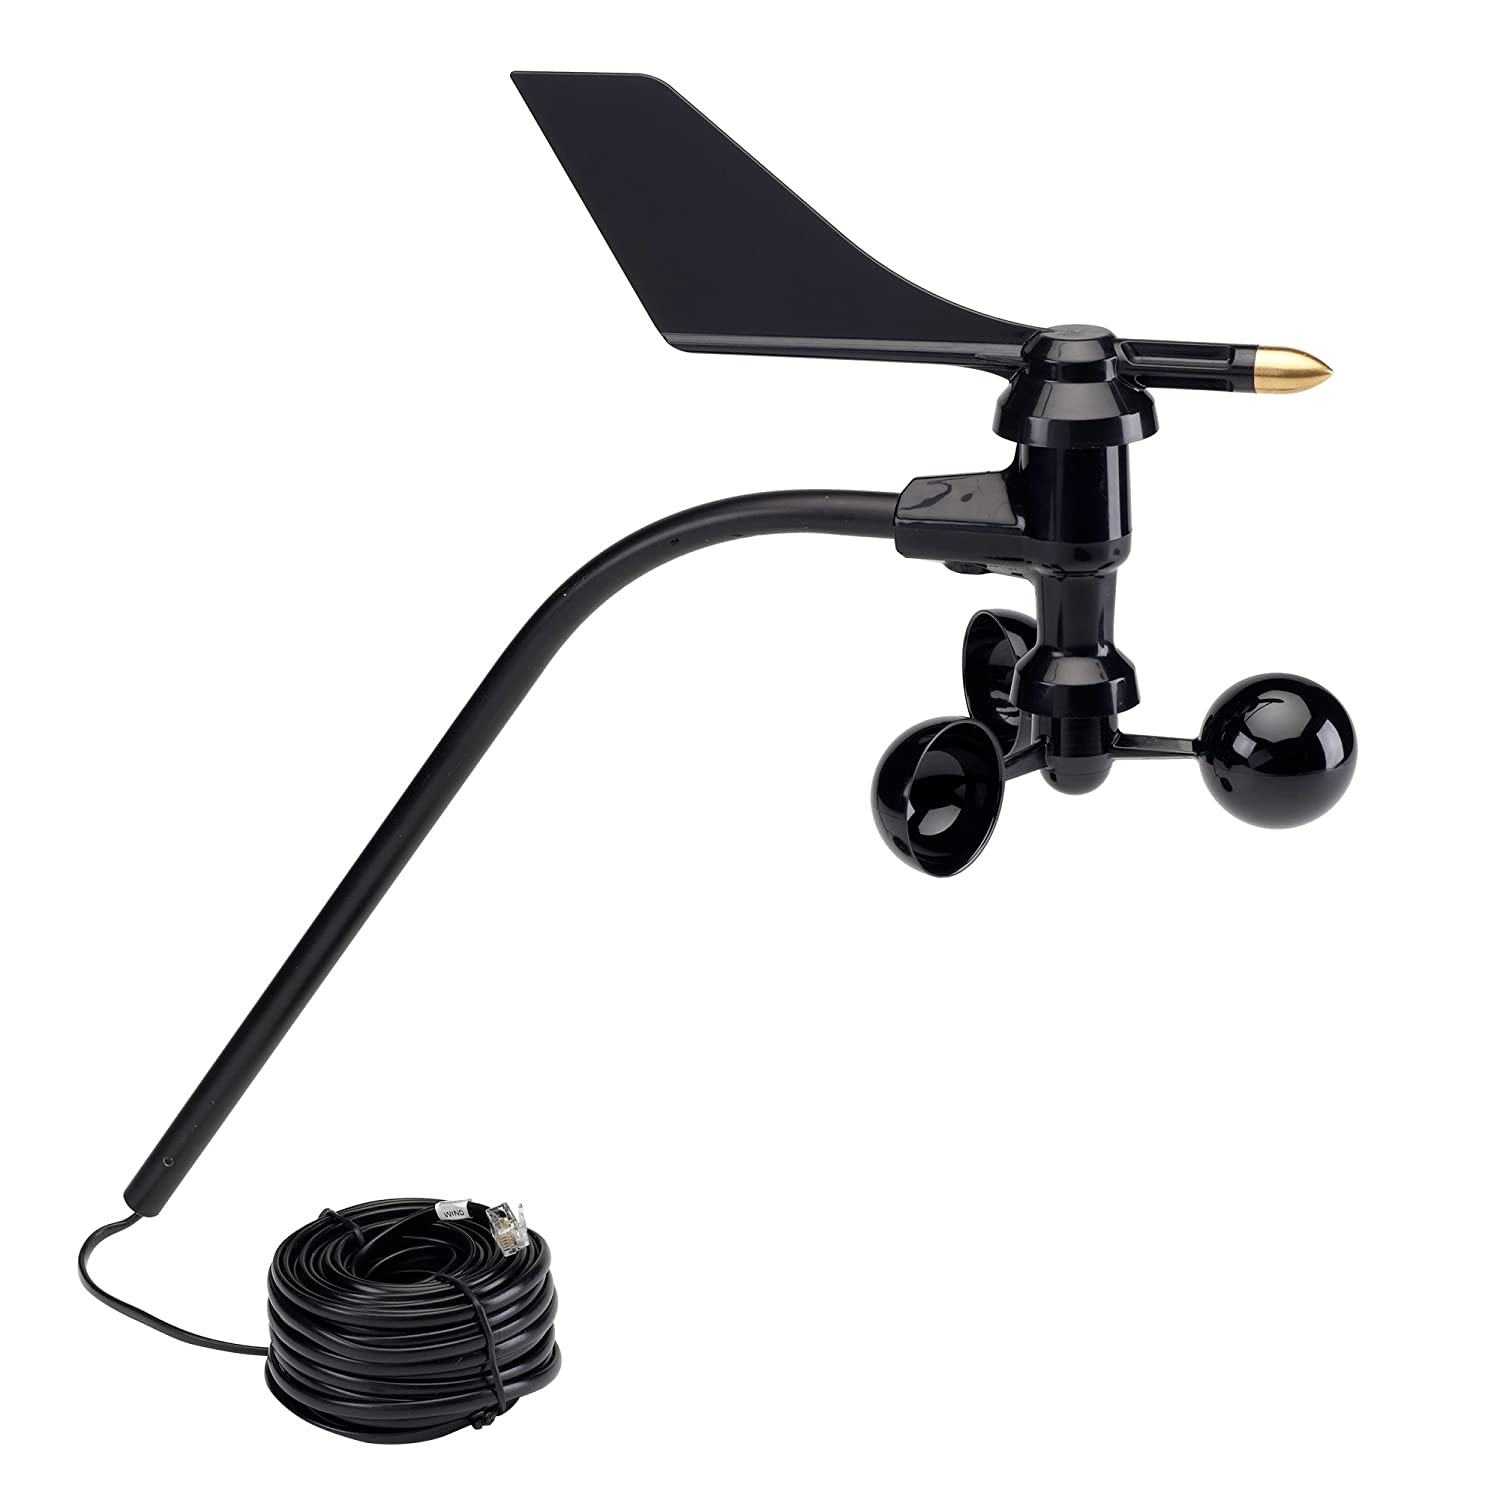
The star of the show here is the Davis 6410 Anemometer. It’s fairly simple: a wind vane mounted on a potentiometer and a set of wind cups mounted to a shaft in which rotations are measured by a Hall-effect sensor. It has 4-wire output to an RJ-11 connector over a 40 foot cable. Here’s the data sheet (pdf) for those who want more deets.
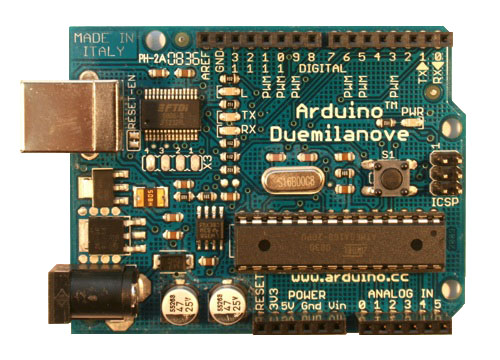
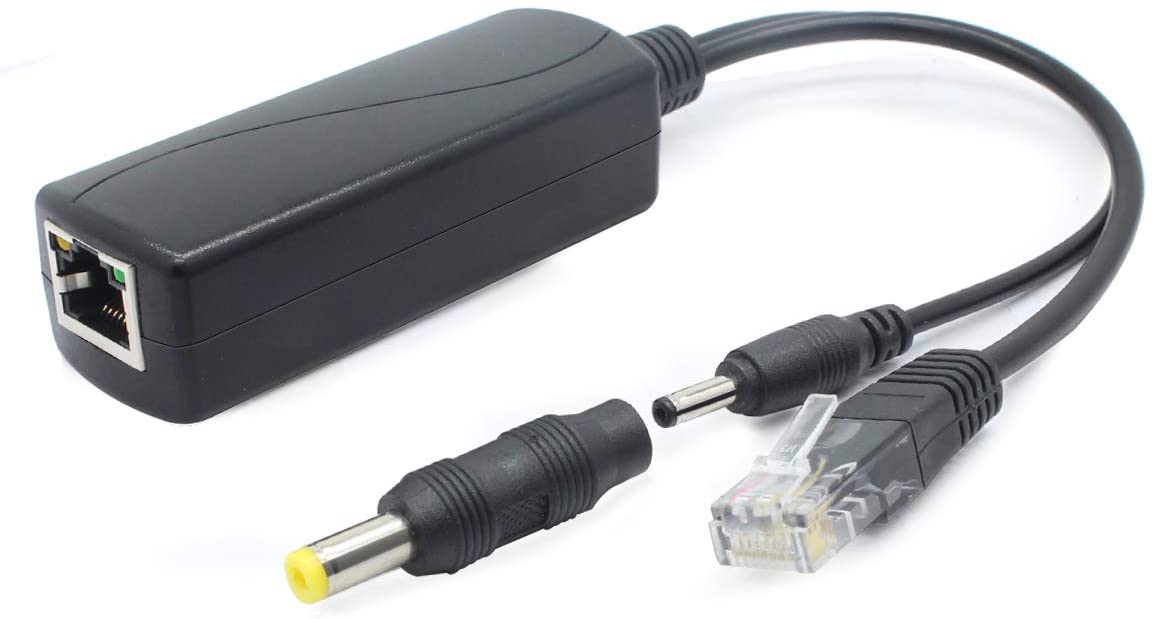
I chose an Arduino Duemilanove simply because I had one laying around. I also had an Arduino Ethernet Shield v2 laying around as well and decided that would be my reader and data sender. I realize it’s kinda old school but I really like wiring everything I can. I also love using PoE because it means only having one wire to run through my attic. So for that reason I grabbed a PoE splitter which would work with my existing switch. To get the anemometer up nice and high, I grabbed a 20 foot flagpole from Harbor Freight. The BOM is at the end of the post for those who just want the parts list.
Requirements
Following the guidelines in section 3.2 of the NOAA ASOS (Automated Surface Observing System), the following requirements were derived:
- Mount the anemometer as close to the prescribed 32.8 feet as possible
- Continuosly measure wind direction and speed once every second
- Five-second wind direction and speed averages are computed and reported from the 1-second measurements
- Two-minute averages of direction and speed are computed and reported
- Direction rounded to nearest degree
- Report wind characteristics (e.g. gusts, squalls)
Requirements deviating from or in addition to the guide:
- The device should be relatively easy to physically remove from the pole for maintenance
- The electronics should live indoors or in the attic
- The device must be hard-wired for both power and data
- The device must be able to survive the heat of a Houston area attic
- Wind speeds will be reported in miles per hour (not knots)
- Wind speed resolution is to the nearest 10th of a mile per hour
- Five second, two minute, and characteristic reports saved for 365 days
- Hourly statistics saved indefinitely
Mounting
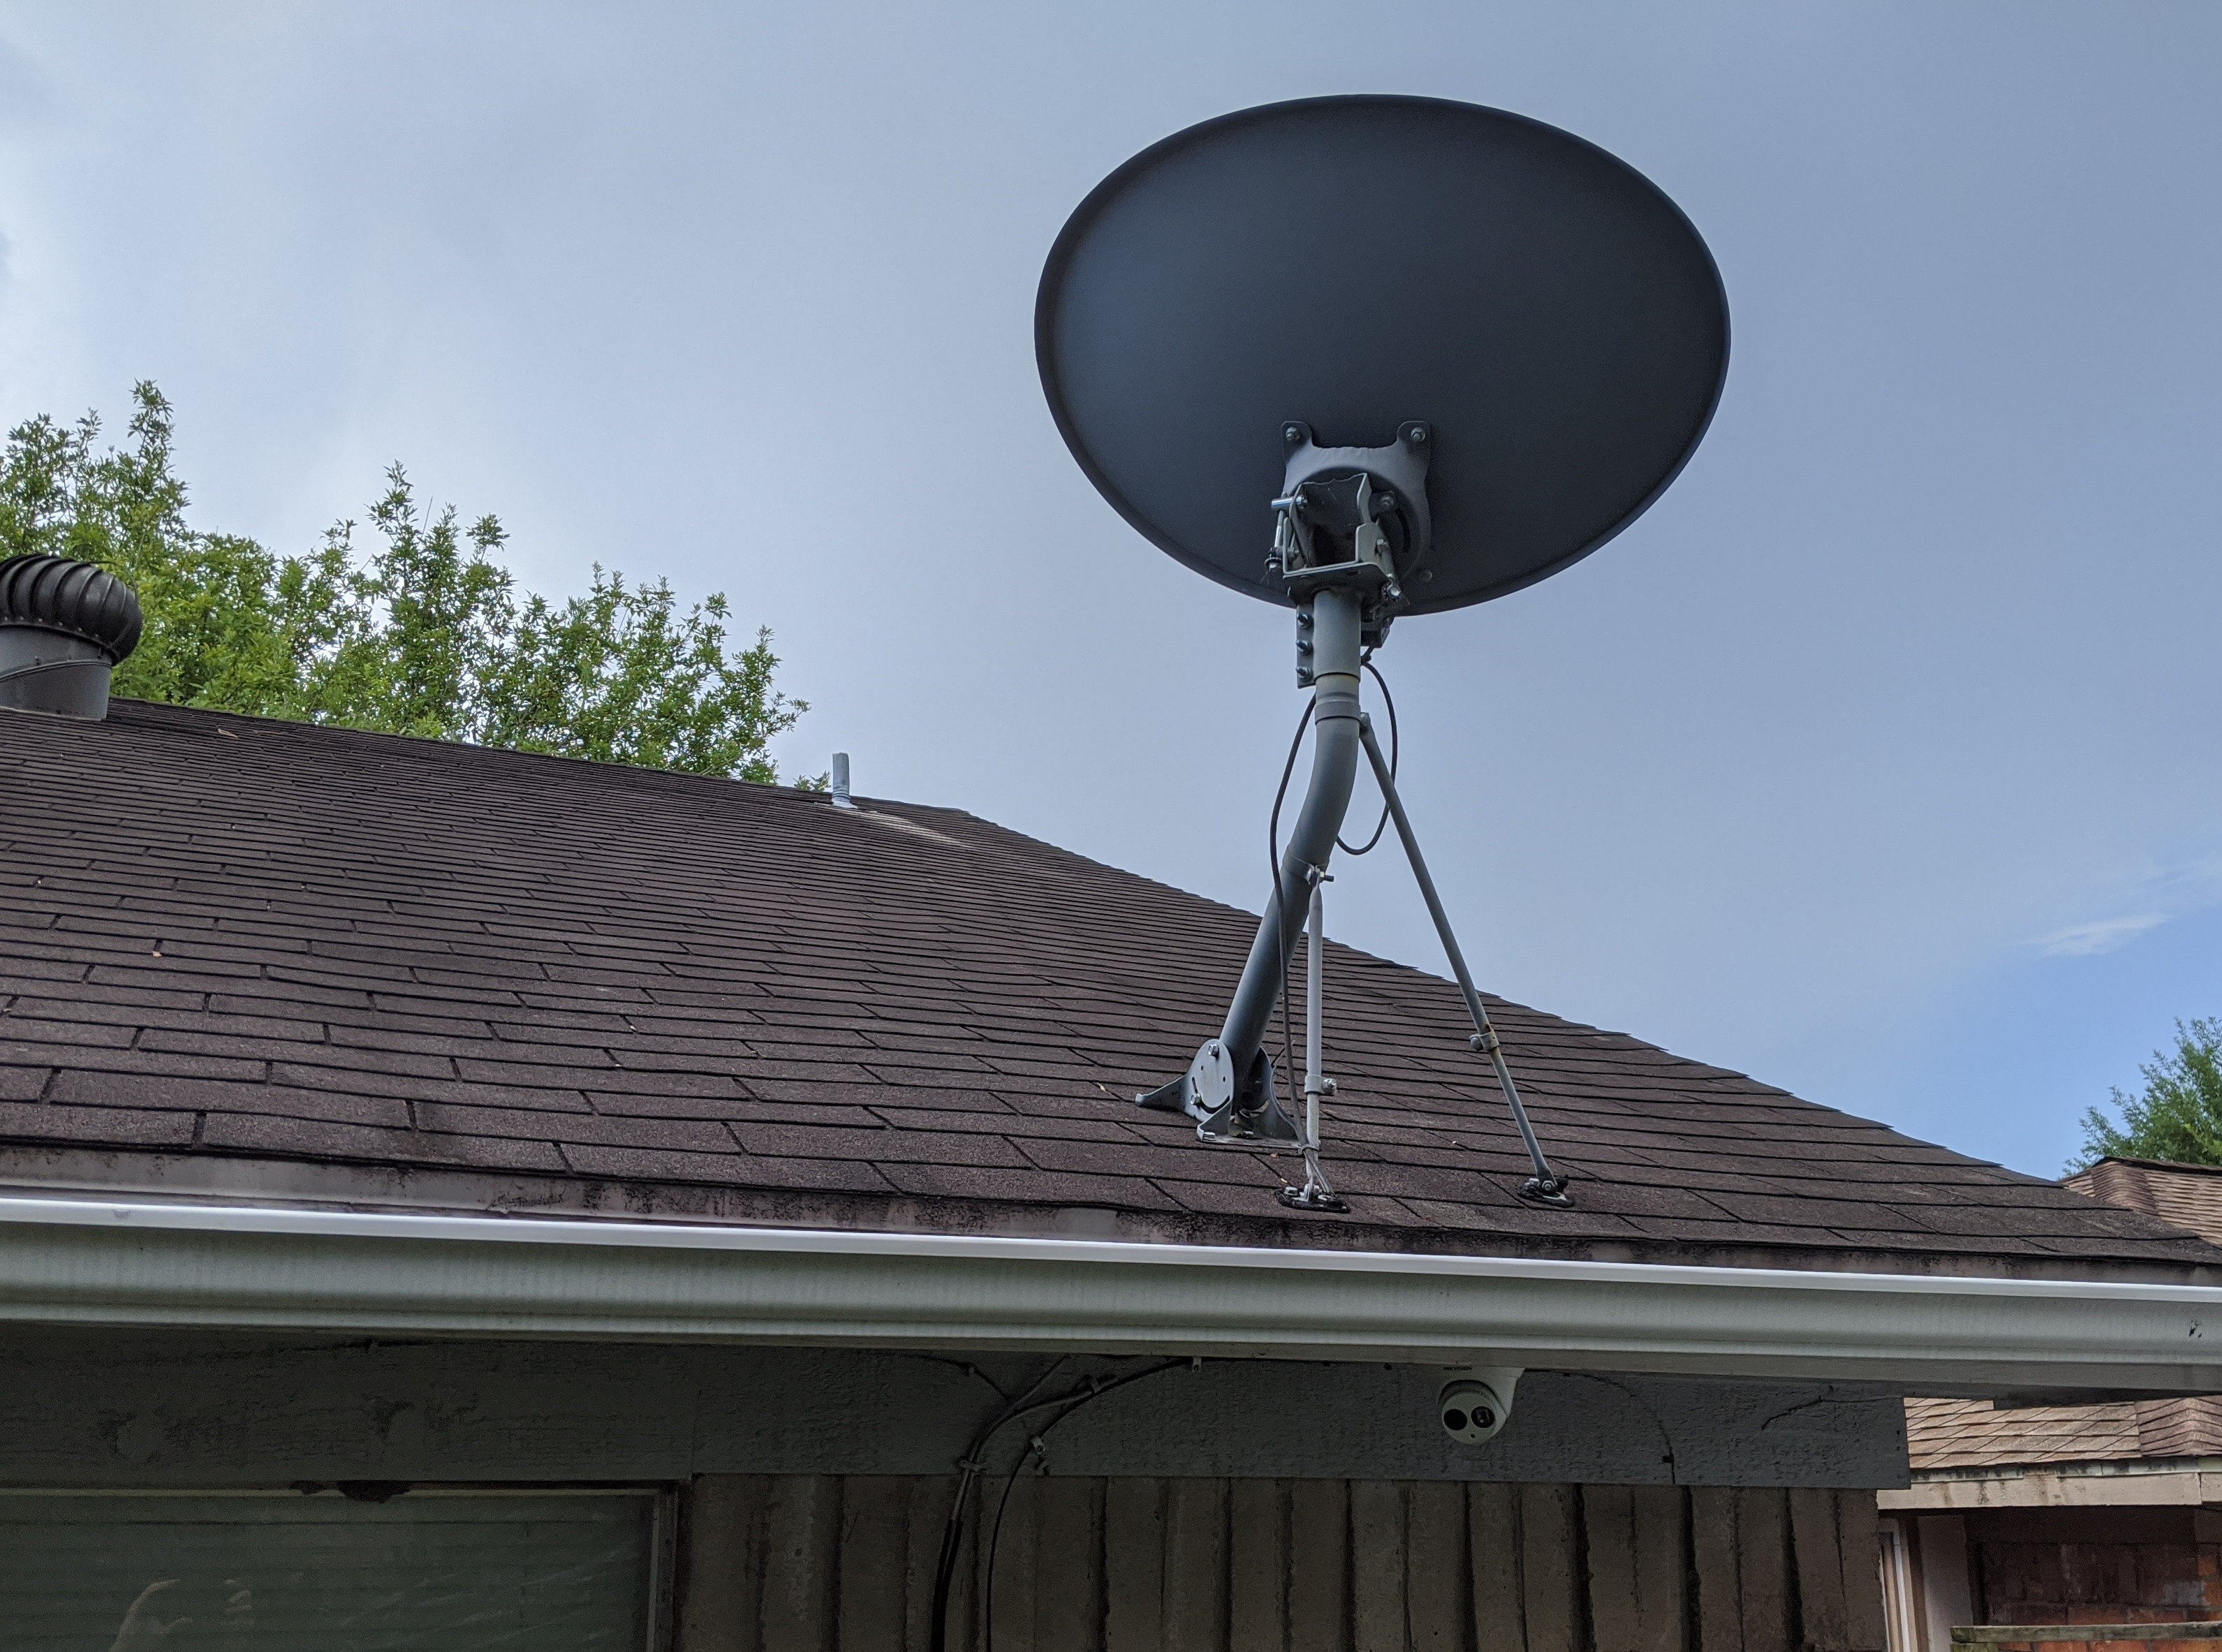
The hardest part of this build was getting the anemometer up high and over the top of the roof. This 20 foot flagpole from Harbor Freight was chosen because it telescopes which helps get it up there in the first place as well ease of getting it back down later. I also figured the flagpole would stand up to reasonable wind speeds (although I never found a spec).
I decided to re-use the mounting supports for an old unused dish and put the pole on my roof:
The flagpole comes with a heavy duty PVC sleeve it slides into that’s meant to be cemented into the ground. I decided to beef it up a bit by getting a much longer mounting tube for the base, using some heavy duty brackets to directly mount it to the roof, and then using clamps to stabilize it against the dish mounts. Because of the hinged mount approach it was easy to place such that it was level in both directions. Here’s the finished test fit of the PVC sleeve and the un-extended flagpole:
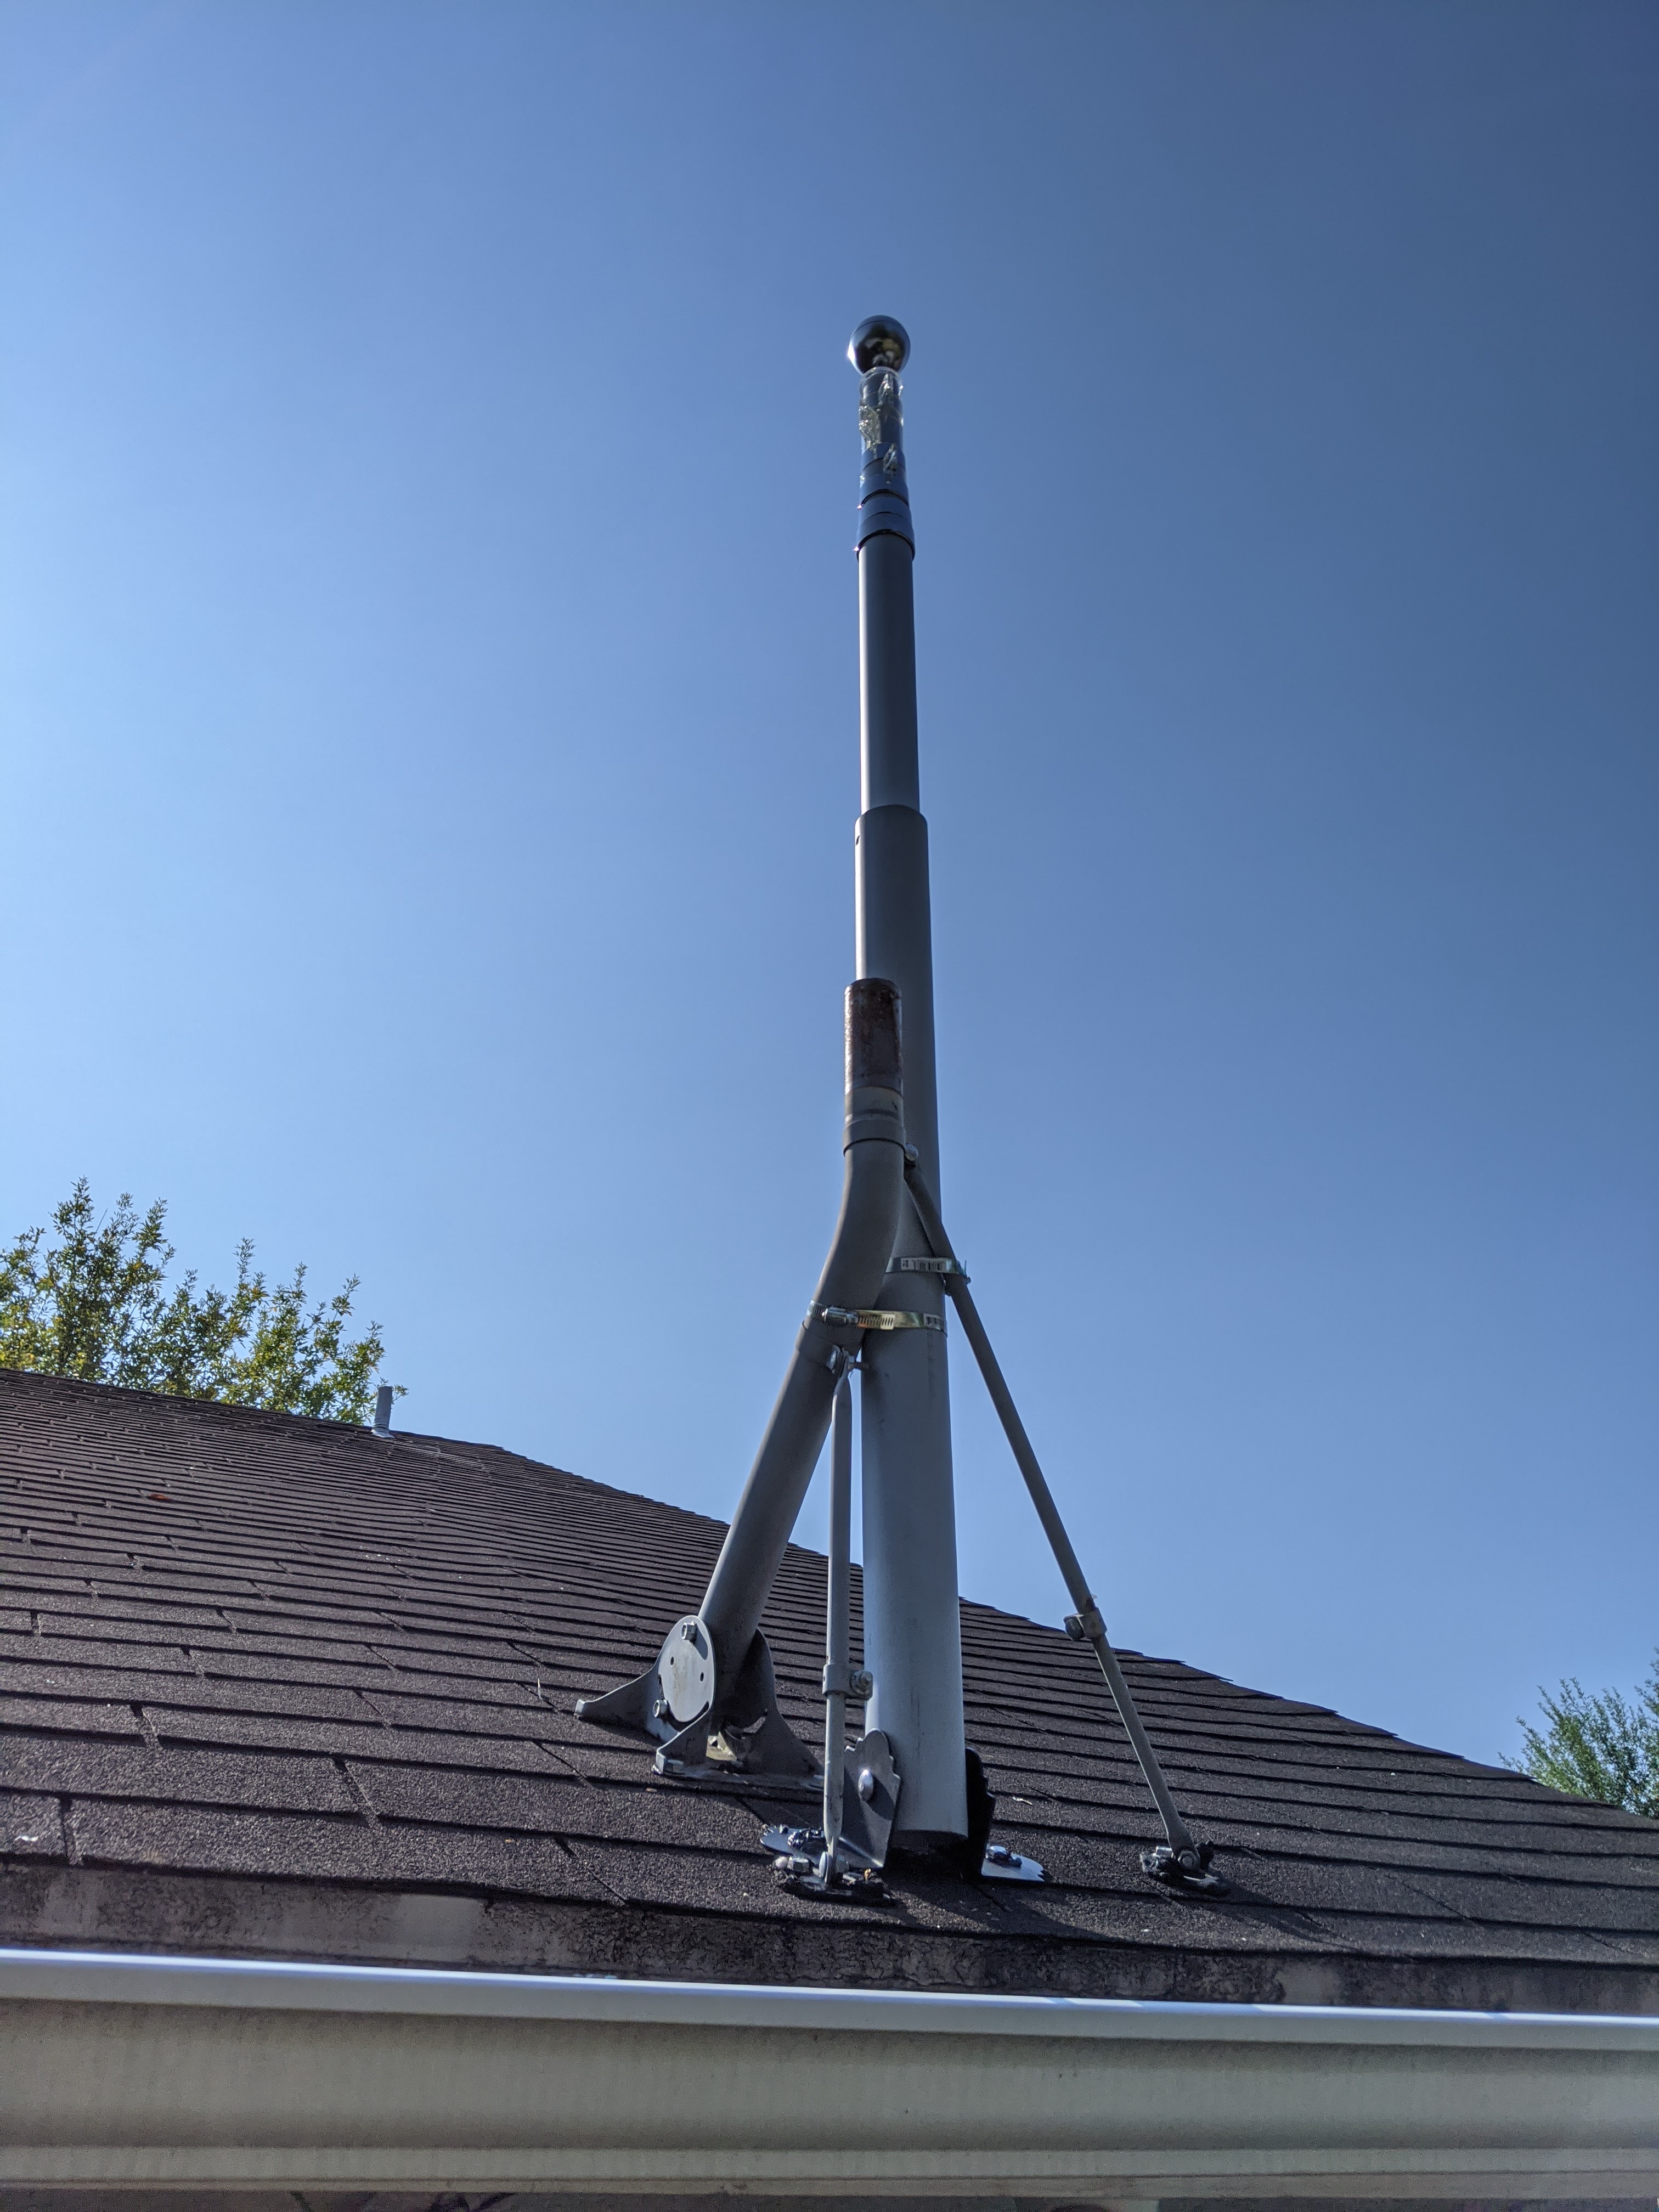
I know there’s mechanical engineers probably yelling at me right now but I’ll update this post if/when the mount ever fails. I simply do not have room on my property for guy wires. I used 5⁄8” lag screws directly into the roof and was sure to slather plenty of this stuff both under the brackets and into the screw holes.
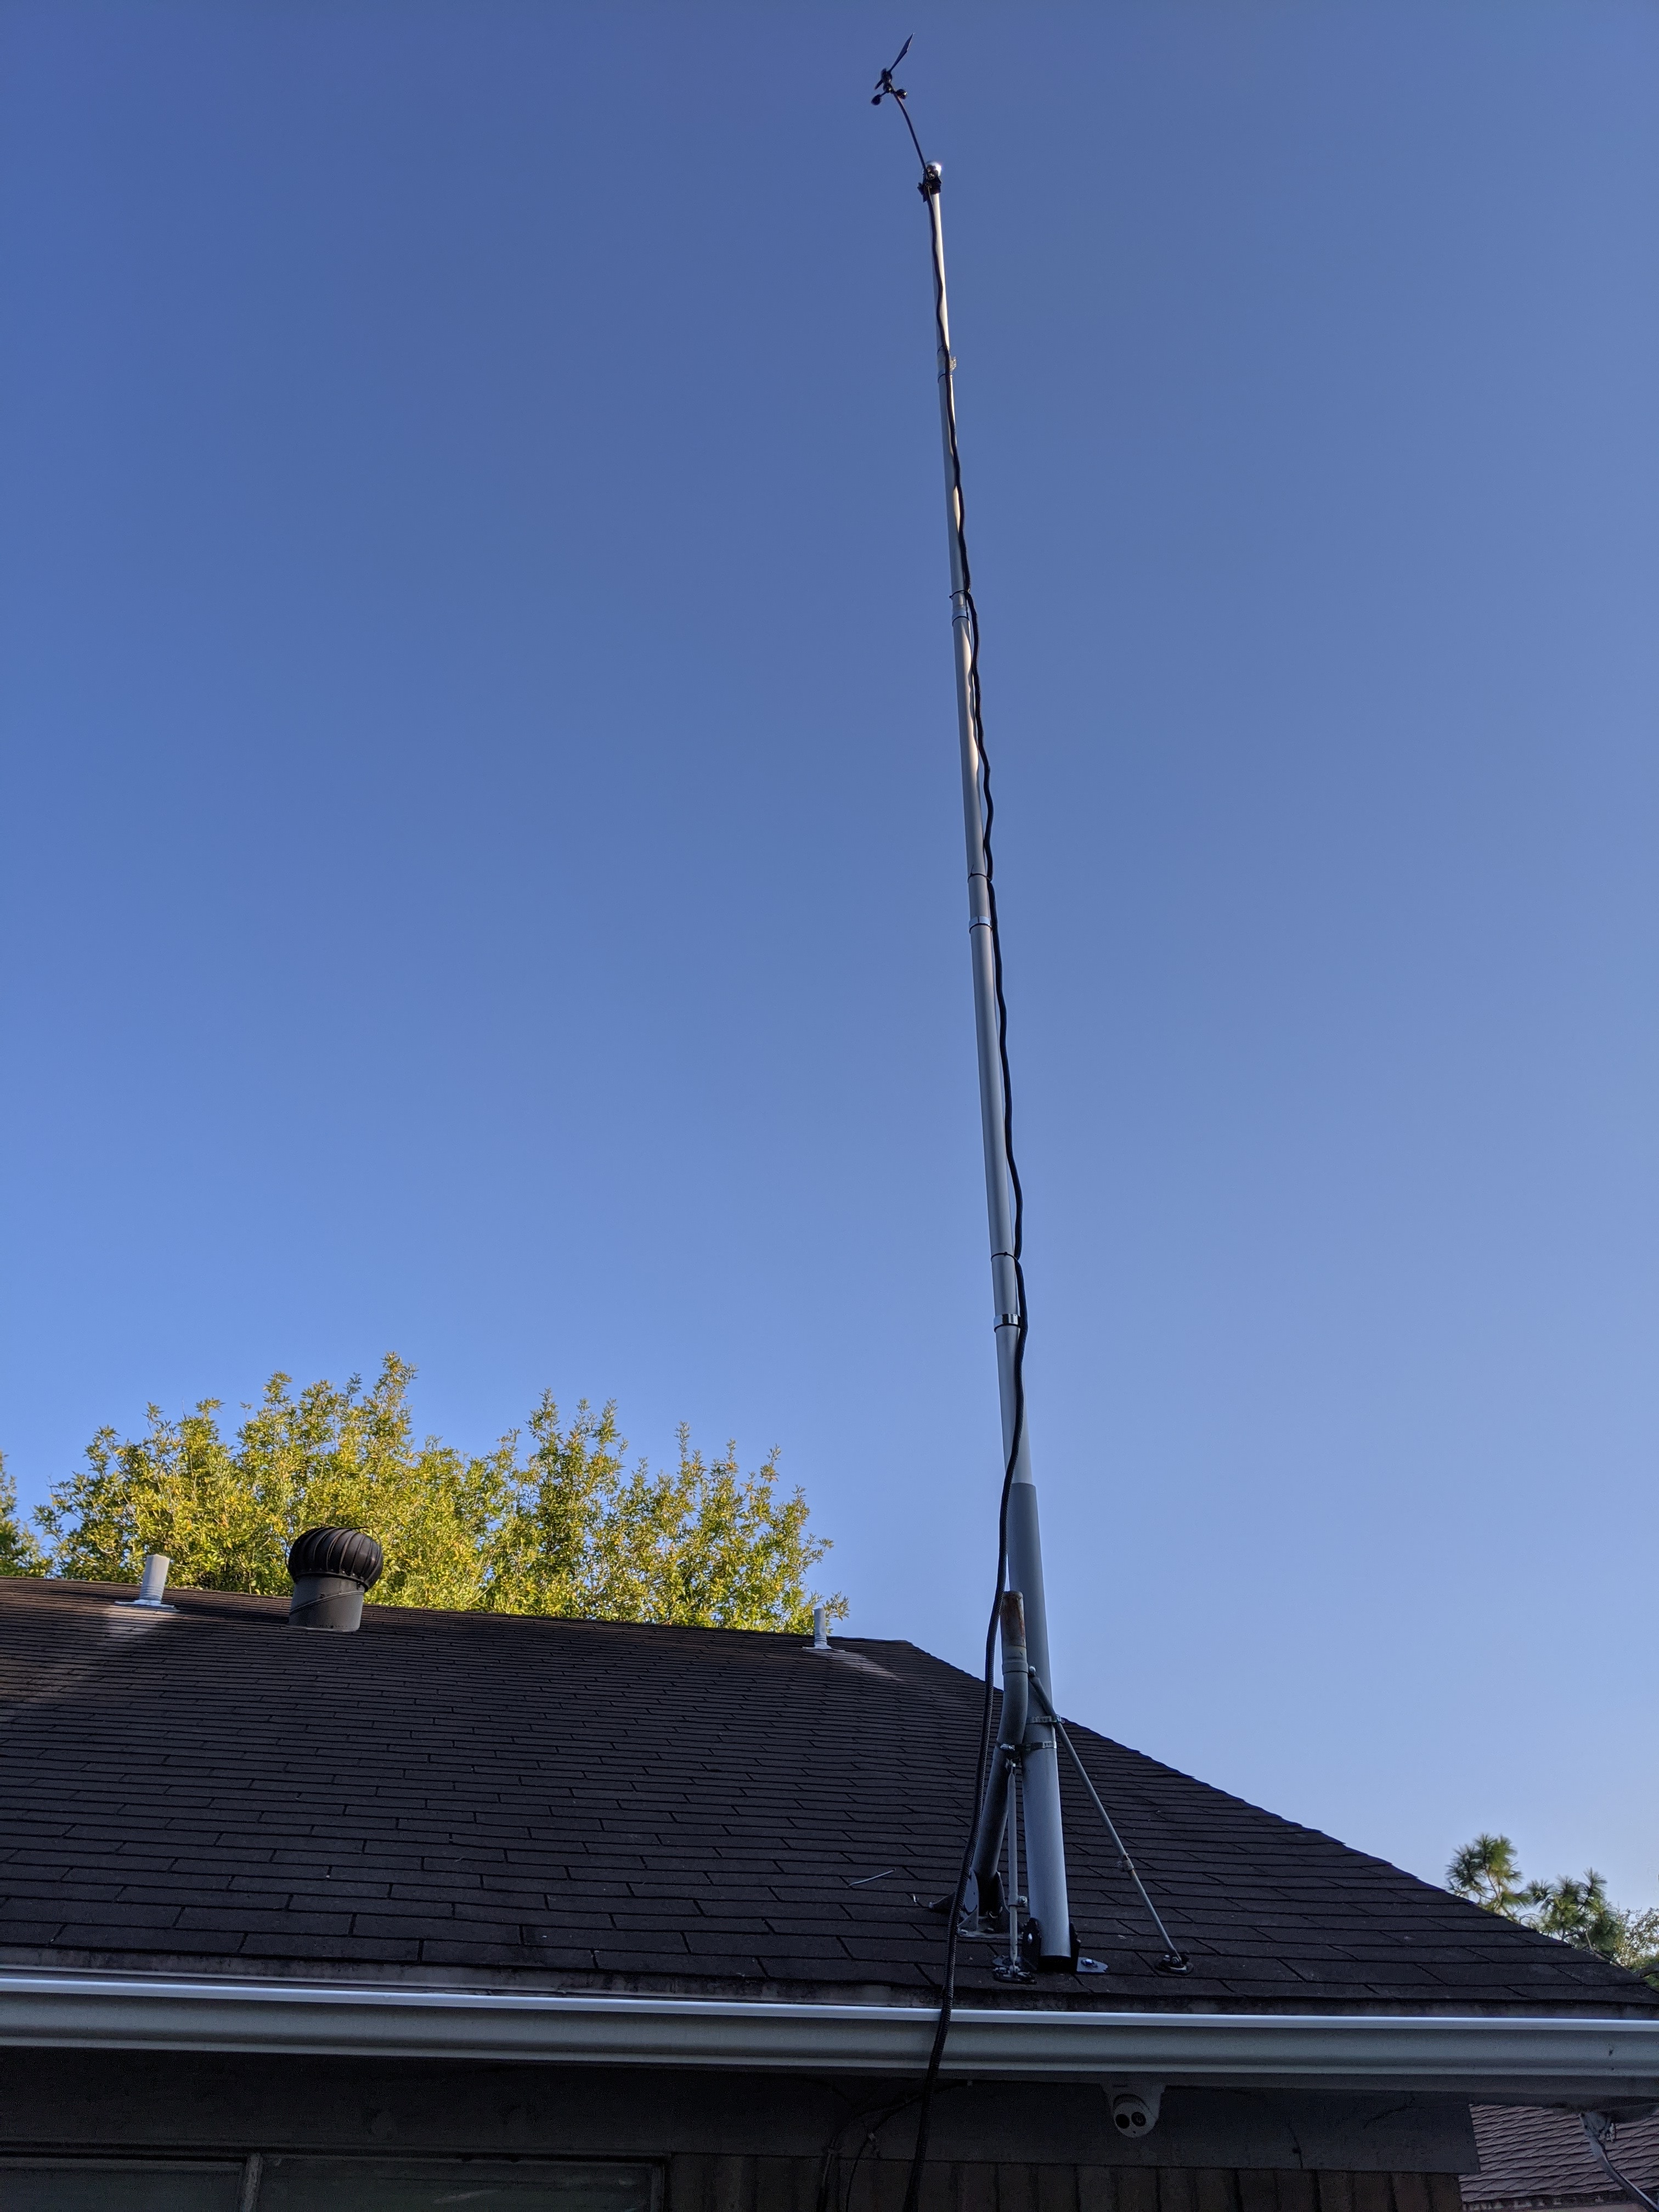
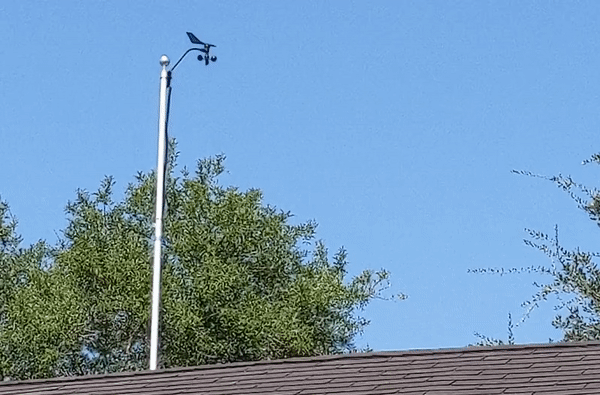
After mounting the anemometer to the pole using the provided bracket, it was telescoped up (each section has a twist lock). After extending the pole all the way up, it was faced due north. Not pictured (though included in the BOM) is the 6 AWG solid copper wire I screwed through the mounting sleeve, into the flagpole itself and ran down to a grounding spike. This also gave the added benefit of not allowing the pole to rotate in the sleeve once the direction was set.
The overall height from the ground is at 29.5 feet! Not quite 32.8 as prescribed but definitely as good as I’m going to get. Now that the mounting is done, on to the electronics!
Hardware
As mentioned the Arduino Duemilanove and Ethernet Shield were stacked and a PoE splitter device used so I would only need to run one network cable through my attic. Both the circuit design and code were largely influenced by this post over at cactus.io. I obtained permission to re-use his excellent circuit diagram here:
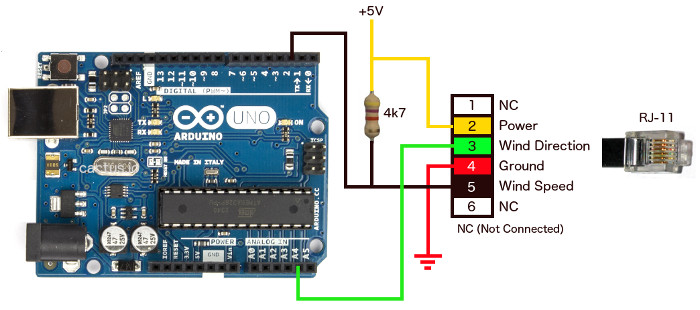
I used this circuit layout exactly, as well as a RJ11 breakout board because I’m super lazy. After building the circuit and cutting really terrible jagged holes in the project box, this is what I ended up with:
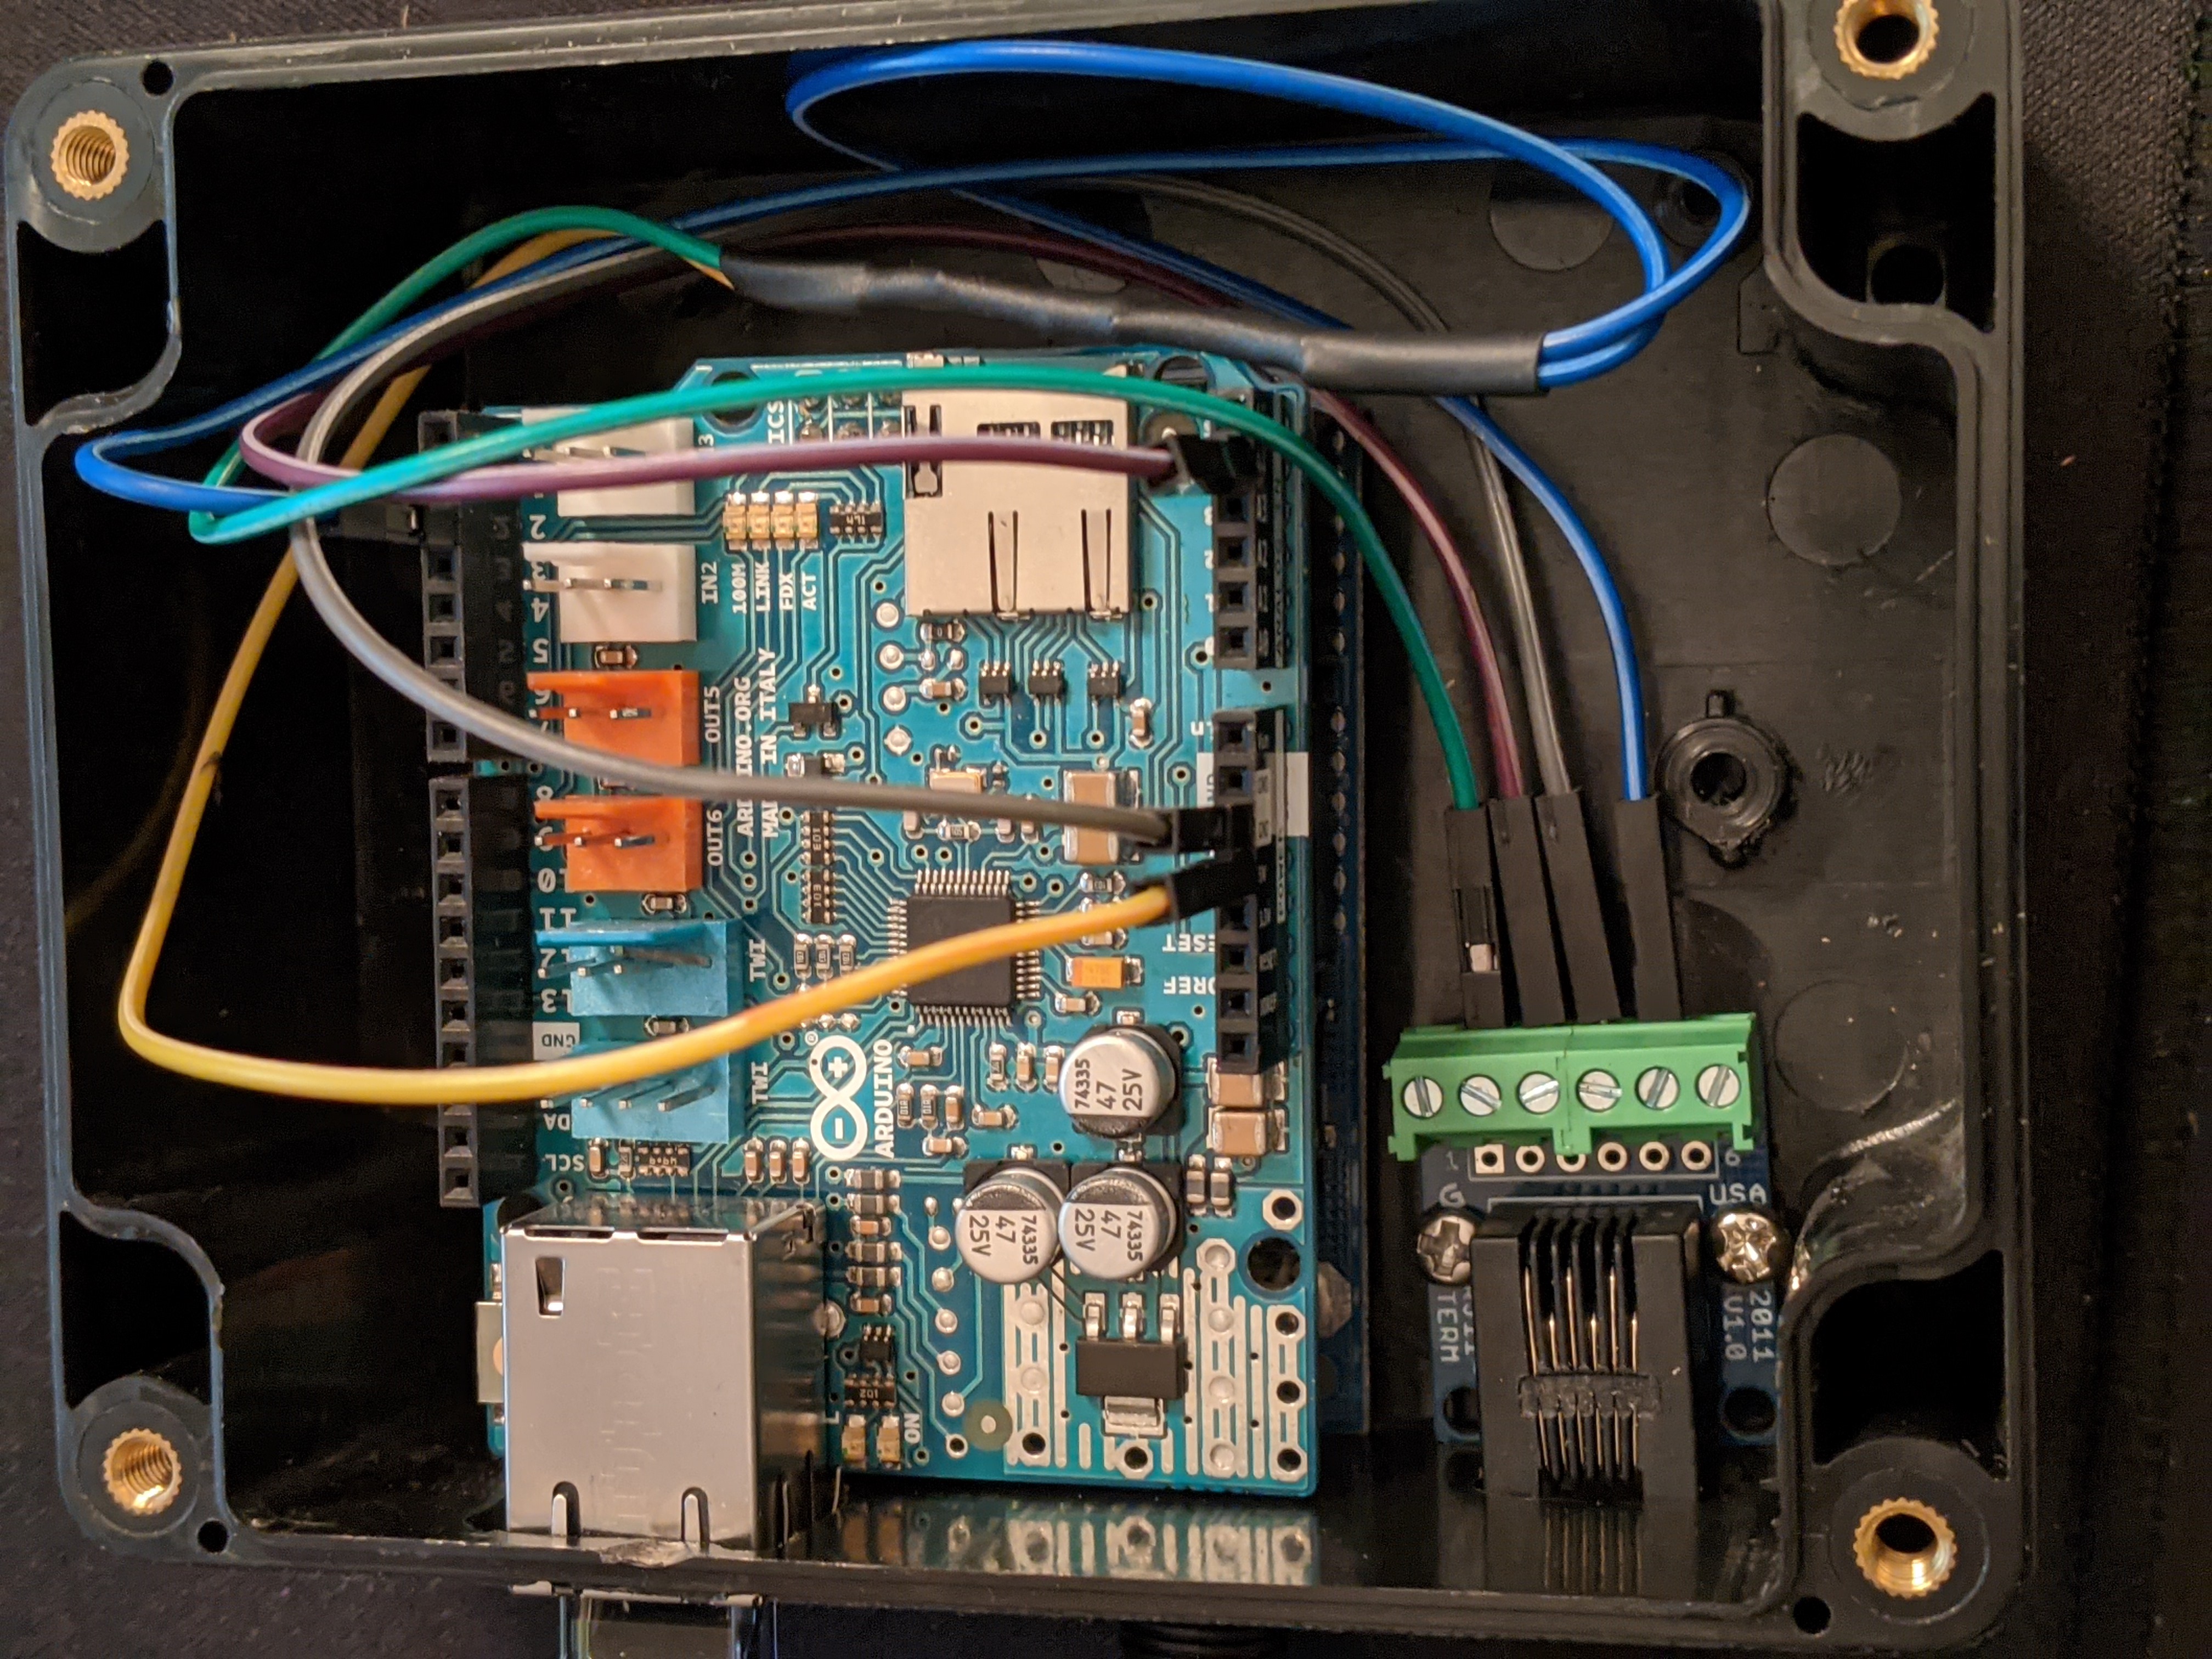
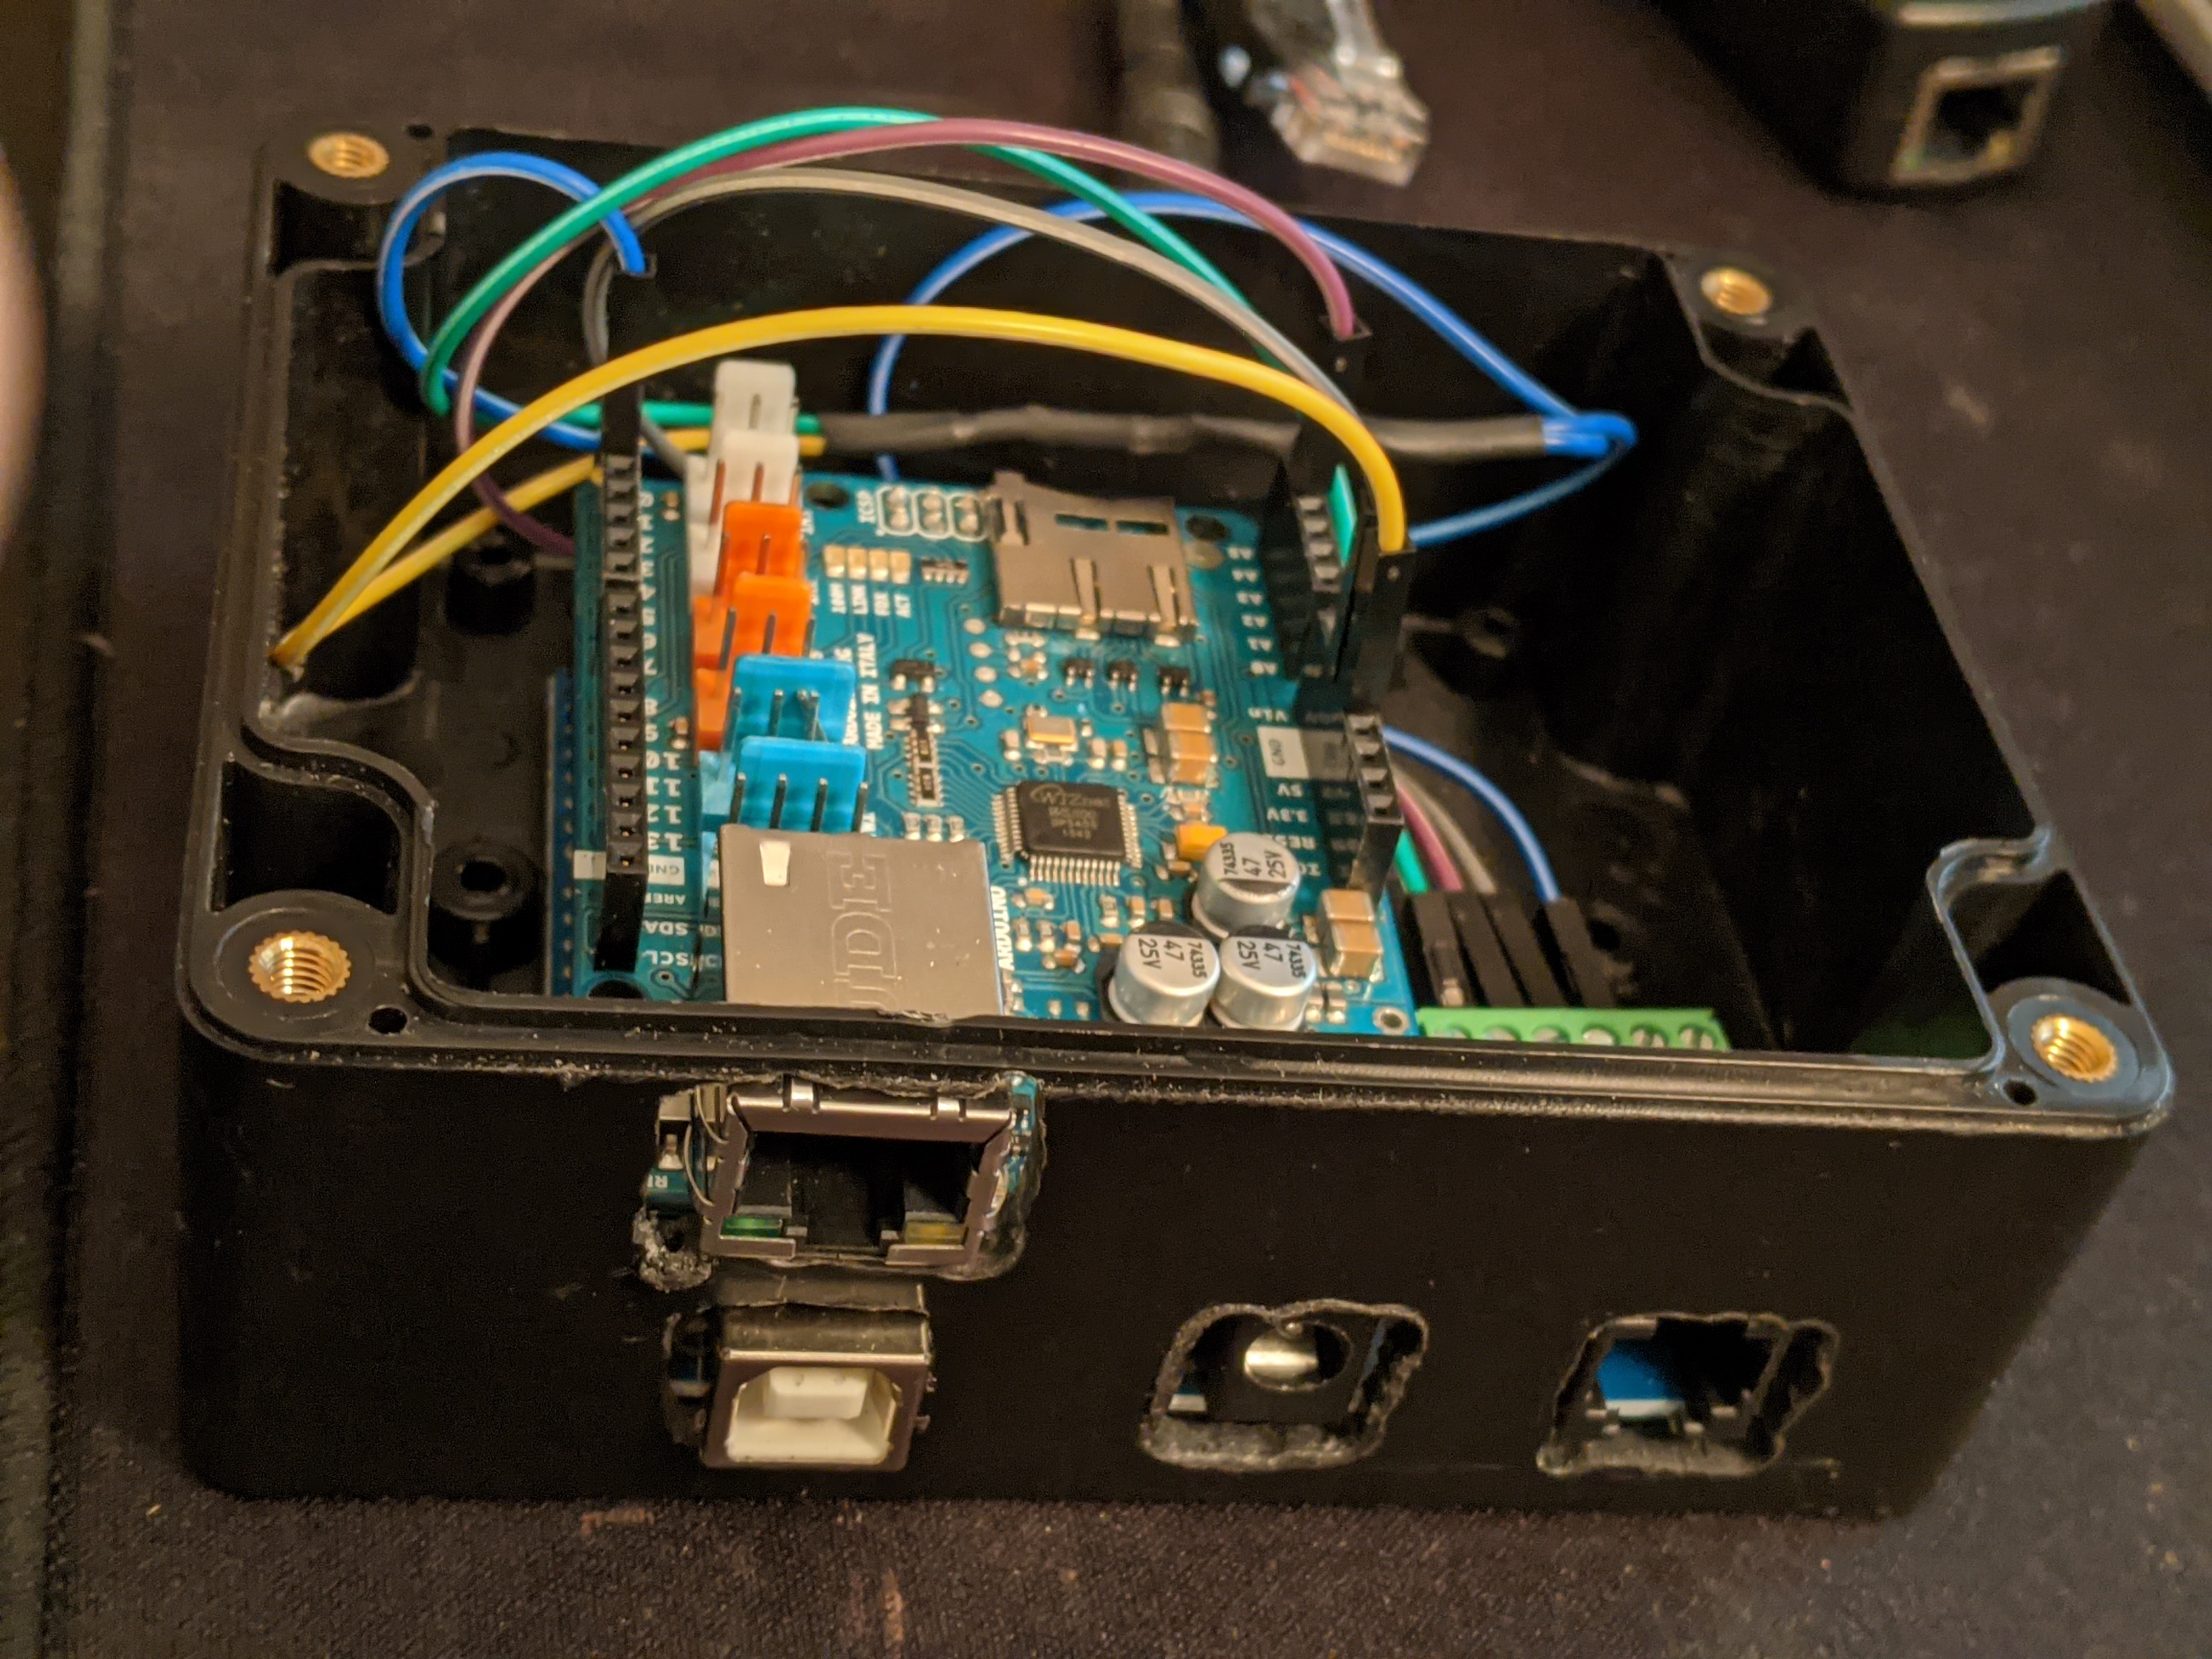
This box is installed in the attic, as the 40 foot anemometer cable would not reach all the way to my network closet. My attic gets to 125°F during the summer which is well within the arduino and barely within the PoE splitter specs. I’ll report back if the splitter dies next summer. From the splitter, PoE goes back to my main PoE switch. On to the software!
Software
The spec sheet (pdf) for the anemometer shows that the rotation sensor is solid state, meaning it’s really easy to read (no de-bouncing required). The repository for the arduino code contains mainly just the arduino ino file. The full stack of data flow is a bit more (probably unnecessarily) complex:

The arduino code uses a straight interrupt to update rotations as they’re detected and a 1Hz loop to do the calculations. I originally had a timer interrupt but that proved to wreak havoc on the Ethernet and/or the MQTT library. I also for a short time had a fully functioning NTP implementation. The idea being that I could store data locally to an SD card (including the timestamps) in case the MQTT broker was down. After realizing the Ethernet and SD card could not be used at the same time (at least not easily) I abandoned this approach. My main server is on a UPS so I shouldn’t have problems with downtime anyways.
The reading of the wind speed follows the NOAA specifications pretty closely and reads wind speeds in base chunks of 5 second averages. These base 5 second averages are used for all other calculations (2 minute averages, gusts, etc). I also originally attempted calculating wind characteristics within the arduino but the NOAA spec is pretty complicated and I decided to leave the arduino side as a “dumb” 5 second / 2 minute average reporter and let the other calculations happen on the server side. The publish from the arduino is to an MQTT topic.
As the data flow above shows, there are several dockers worth of software reading/massaging/saving the data. A typical approach for some would be using InfluxDB as weather data fits well to its time-series database model. I, however, am a recovering SQL addict and as such use it all over the place. After all, 12x60x24x365 = is only six million rows or so a year, but I digress. The data’s journey out of the arduino via MQTT first makes a stop at a Node-RED flow which is so simple it almost wasn’t worth posting here:
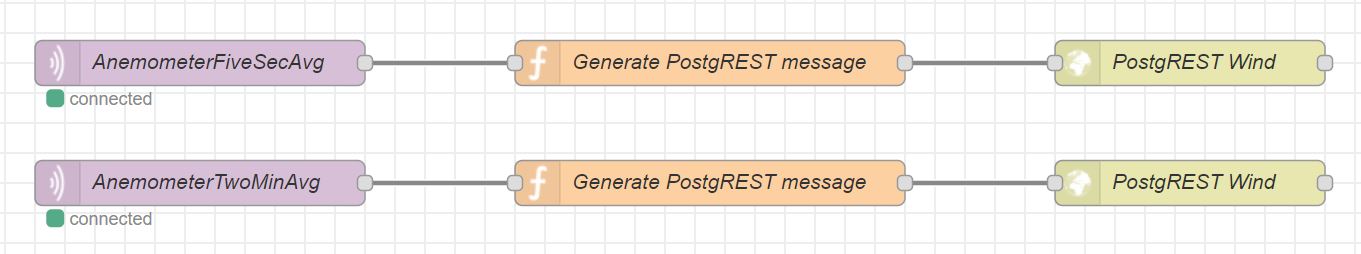
This flow takes the MQTT topic data and uses a function to generate a message consumable by PostgREST (a REST API front-end for PostgreSQL). The function contents generate the REST API message, as follows:
new_msg = {};
new_msg.headers = {};
new_msg.headers['Content-Type'] = 'application/x-www-form-urlencoded';
new_msg['payload'] = {};
new_msg.payload['_speed'] = msg.payload.speed;
new_msg.payload['_direction'] = msg.payload.direction;

return new_msg;
The PostgREST consumes the REST call and automagically executes a stored function on the PostgreSQL server which looks like this:
CREATE FUNCTION wind_insert(_speed double precision, _direction integer)
    RETURNS void
    LANGUAGE 'sql'
    VOLATILE
AS $BODY$
INSERT INTO weather_wind(datetime, speed, direction)
 VALUES (NOW(), _speed, _direction)
$BODY$;
Note that it’s here that the data gets timestamped. This should be fine considering these are five second wind averages and the time it takes from the arduino all the way to the database is only 100 milliseconds or so.
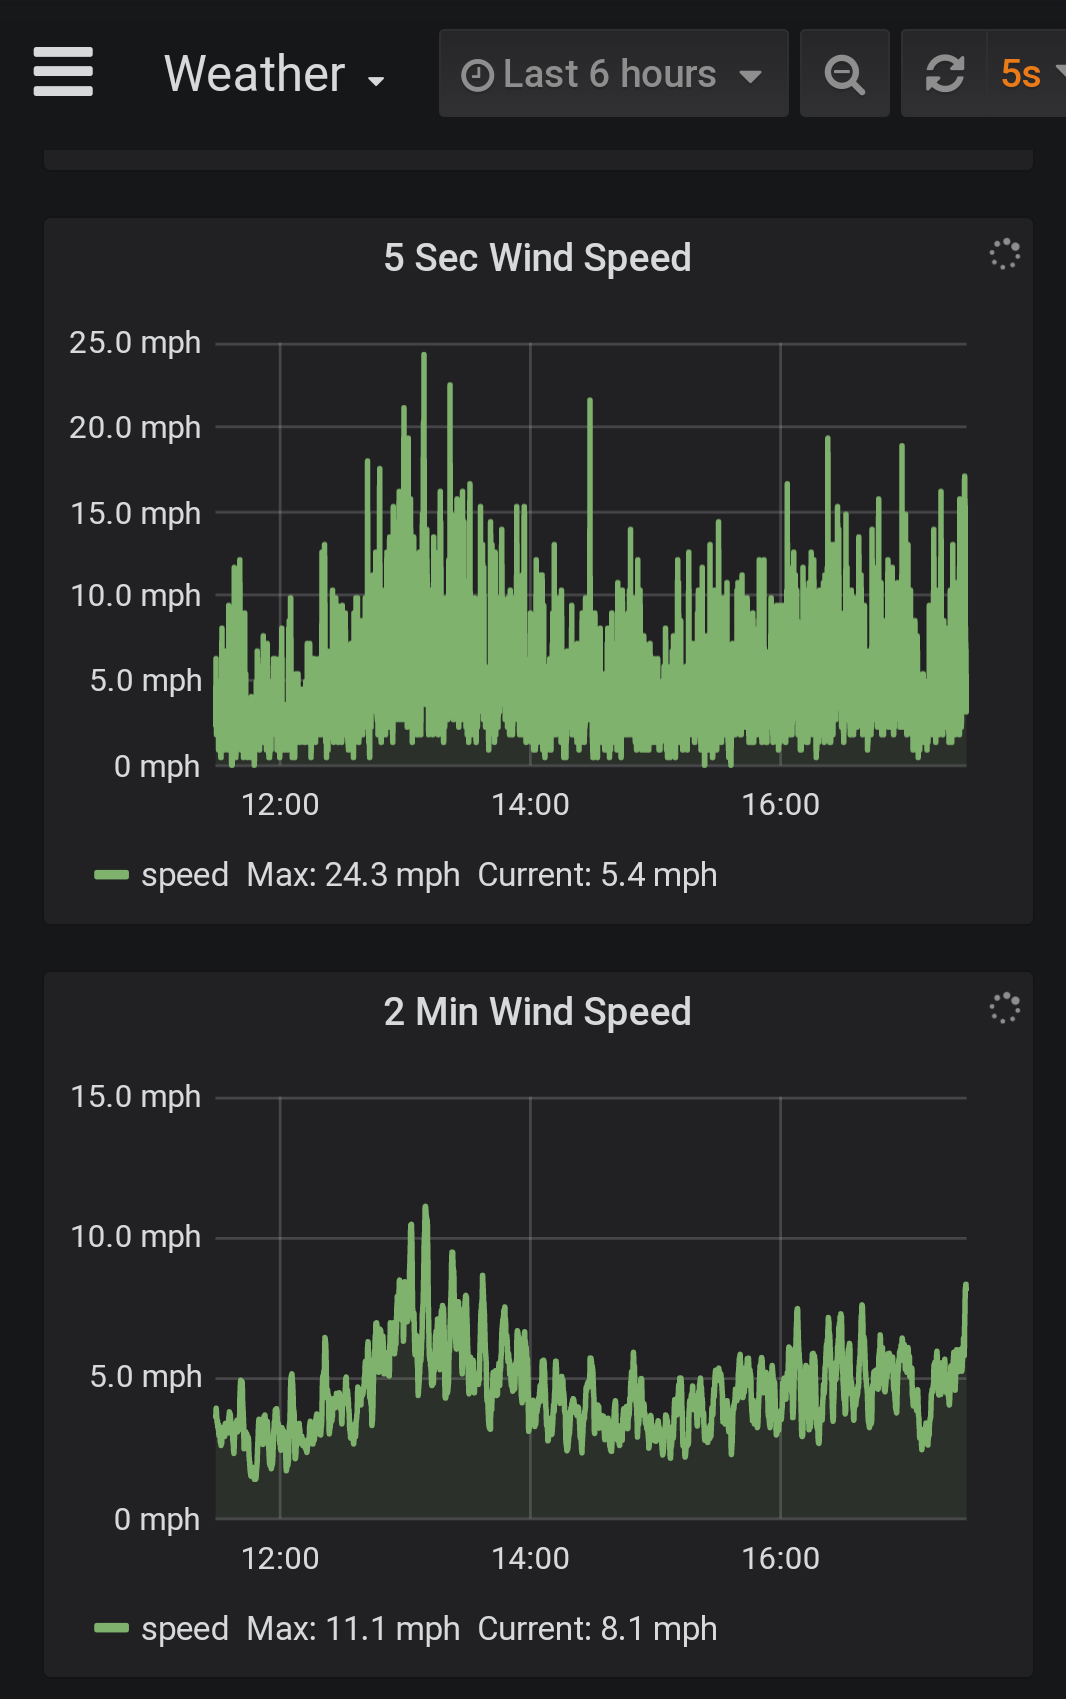
Once the data is in the database, Grafana is used along with its PostgreSQL data source to generate graphs. These are plain, boring graphs and the intention is to improve them later. This screenshot is from my phone during our very slight encounter with the outer edge of Hurricane Delta:
A quick fun test with the leaf blower lets me know at least the anemometer itself (if not the flagpole) should survive hurricane force winds:
That is pretty much it for the build! As of this writing it’s been up and running for a couple of weeks and working great. The highest winds it’s seen so far have been about 24 mph and hopefully it’ll withstand much higher as we do see hurricanes where I live and it’d be great to get data from them.
Lessons Learned
- By far the hardest/most expensive part of this build was mounting the anemometer high enough.
- Arduinos do great for repetitive mundane things, just don’t try to get too fancy (e.g. NTP and timer interrupts along with Ethernet did not work well together).
Future Work
- A companion weather station with rain gauge, temperature, pressure, and humidity sensors is in the works.
- Add software processes to calculate and save gusts/wind characteristics as per section 3.2.2.2 of the NOAA guidelines document.
- Make prettier graphs and graphs/gauges which better show wind direction.
- Add database procedures to cull down old data and save records and averages.
- Add alerts for new records.
- Add exports to NOAA or amateur weather contribution sites.
Supporting Documentation / Links
- Gitlab code repo for arduino
- NOAA ASOS User’s Guide (pdf)
- cactus.io Davis Anemometer Hookup Guide
- Davis 6410 Anemometer Data Sheet (pdf)
- WXForum.net
Bill of Materials
Note this was cost to me, there were a few parts like the arduino I already had on hand so included them but at zero cost. Note that $125 of the cost was just in mounting the thing!
| item | shipped/taxed price |
|---|---|
| Davis 6410 Anemometer | $119.67 |
| Harbor Freight Flagpole | $70.35 |
| PoE splitter | $14.05 |
| RJ11 breakout | $11.89 |
| Split loom to protect cable | $11.64 |
| Project box | $7.45 |
| Ground spike clamps and 6 awg copper wire (Home Depot) | $34.49 |
| Misc brackets / mounting hardware & supplies (McCoys) | $20.33 |
| Arduino | $0 (existing) |
| Arduino Ethernet Shield | $0 (existing) |
| my total | $289.87 |
Thanks
Thanks for reading my post! I hope you enjoyed it. If you really thought it was useful to you, feel free to buy me a coffee by using the button on the lower right. A companion weather station is currently in the works and I’ll link that post here when it’s completed.